Using Calculated Members to Add Information
Numerical information
In Part 2 we looked at some basic examples of Calculated Members where we calculated and displayed the VAT amount, then added it to the Sales Revenue to get the Sales Revenue including VAT.
Quick Recap
Similarly, other calculations could be done to calculate values like the Gross Margin. Typically, this is defined within the TM1 model but the below view is purely a recap and to ensure that the concepts are clear before moving on.
Where we are looking at Sales in a particular period and are displaying the Total Sales Revenue and the Cost of Sales, we may want to also show the Gross Margin and Gross Margin %.
We will start with a simple view like the one below:

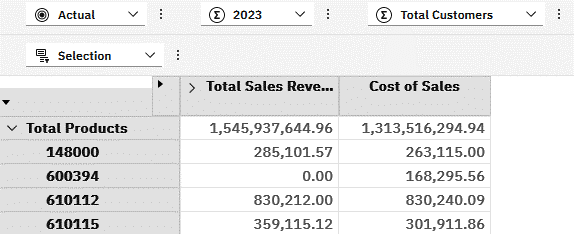
The MDX for the view is as follows:
					SELECT
NON EMPTY
	{[Sales Measures].[Sales Measures].[Total Sales Revenue],
	 [Sales Measures].[Sales Measures].[Cost of Sales]} ON 0,
NON EMPTY
	{Descendants([Product].[Product].[Total Products])} ON 1
FROM [Sales]
WHERE ([Scenario].[Scenario].[Actual],
	[Period].[Period].[2023],
	[Customer].[Customer].[Total Customers])
To add the extra columns, we will need to add in some code for the Calculated Members:
					WITH MEMBER [Sales Measures].[Sales Measures].[Gross Margin] AS
	[Sales Measures].[Sales Measures].[Total Sales Revenue]-
	[Sales Measures].[Sales Measures].[Cost of Sales],
	SOLVE_ORDER = 1, FORMAT_STRING = '#,##0.00;(#,##0.00)'

	MEMBER [Sales Measures].[Sales Measures].[Gross Margin %] AS
	([Sales Measures].[Sales Measures].[Gross Margin]/
	[Sales Measures].[Sales Measures].[Total Sales Revenue]),
	SOLVE_ORDER = 2, FORMAT_STRING = '#.00%;(#.00)%'

SELECT
NON EMPTY
	{[Sales Measures].[Sales Measures].[Total Sales Revenue],
	 [Sales Measures].[Sales Measures].[Cost of Sales],
	 [Sales Measures].[Sales Measures].[Gross Margin],
	 [Sales Measures].[Sales Measures].[Gross Margin %]} ON 0,
NON EMPTY
	{Descendants([Product].[Product].[Total Products])} ON 1
FROM [Sales]
WHERE ([Scenario].[Scenario].[Actual],
	[Period].[Period].[2023],
	[Customer].[Customer].[Total Customers])
The updated view shows me the additional columns with the Gross Margin amount and Gross Margin %
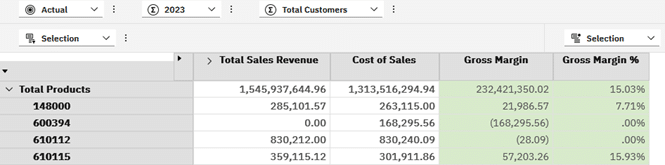
Note it in the code that the Solve_Order on Gross Margin is 1 so that I could use the result in the second calculation, Gross Margin %.
Also note that I applied a different Format_String to the Gross Margin % to see results as a percentage.
Thousands, Millions and Billions
There is often a requirement to show values in Thousands or Millions. You can do this natively in PAW. In versions pre 2.0.94 all values would change but from PAW 2.0.95 onwards there are more granular capabilities to format members.
However, for our purposes we will create a Calculated Members to do this for us. Before we look at the example, there is a lot of debate around whether this should be done in the TM1 model using feederless C: level rules but my preference is to rather push this to the UI where the requirement is and limit the processing there.
Based on the example in the recap above, I am sure you have already worked out how simple this is to do should we want to view Total Sales Revenue and Cost of Sales on a different scale e.g. Millions.
We can simply divide our Sales Measures by 1,000,000 and then display the Calculated Members instead of the Sales Measures:
					WITH MEMBER [Sales Measures].[Sales Measures].[Total Sales Revenue (M)] AS
	[Sales Measures].[Sales Measures].[Total Sales Revenue]/1000000,
	SOLVE_ORDER = 1, FORMAT_STRING = '#,##0.00;(#,##0.00)'

	MEMBER [Sales Measures].[Sales Measures].[Cost of Sales (M)] AS
	[Sales Measures].[Sales Measures].[Cost of Sales]/1000000,
	SOLVE_ORDER = 2, FORMAT_STRING = '#,##0.00;(#,##0.00)'

SELECT
NON EMPTY
	{[Sales Measures].[Sales Measures].[Total Sales Revenue (M)],
	 [Sales Measures].[Sales Measures].[Cost of Sales (M)]} ON 0,
NON EMPTY
	{Descendants([Product].[Product].[Total Products])} ON 1
FROM [Sales]
WHERE ([Scenario].[Scenario].[Actual],
	[Period].[Period].[2023],
	[Customer].[Customer].[Total Customers])
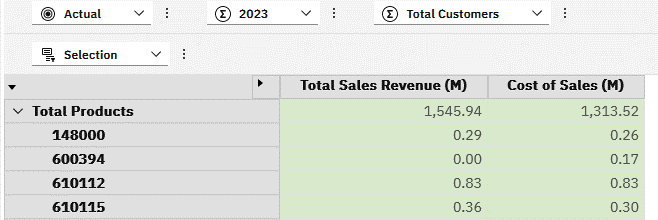
This code renders a view per below:
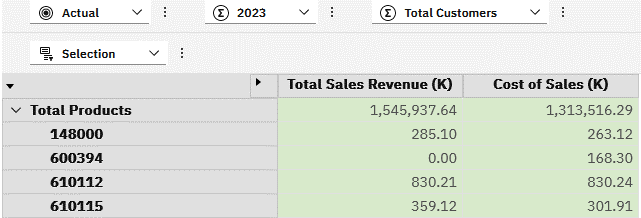
Maybe the scale is not too suitable and Thousands would be better for the Product level:
I am sure you can adjust the MDX code accordingly and do not need the example here.
Read-Only Values
Based on the above view, you will note that the Calculated Members are displayed in green shading in PAW. This denotes that they are calculated but also that they are not modifiable and can be seen as read-only.
In some user views, there is a case to make cells read-only to avoid inadvertent changes where security may not be applied to the cells.
You can easily convert the view to a read-only view by creating additional members based on the original ones in the view and displaying these instead. The hardest part of this is finding a consistent naming convention to ensure that the Calculated Members do not clash with existing members and create ambiguity.
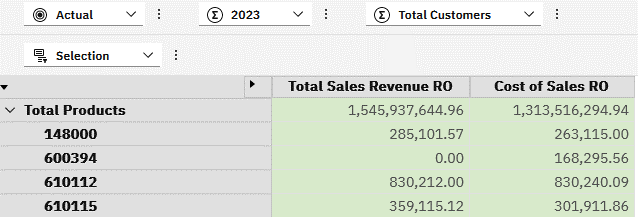
In my example for simplicity, I add RO to indicate Read-Only at the end of the Sales measures.
					WITH MEMBER [Sales Measures].[Sales Measures].[Total Sales Revenue RO] AS
	[Sales Measures].[Sales Measures].[Total Sales Revenue],
	SOLVE_ORDER = 1, FORMAT_STRING = '#,##0.00;(#,##0.00)'

	MEMBER [Sales Measures].[Sales Measures].[Cost of Sales RO] AS
	[Sales Measures].[Sales Measures].[Cost of Sales],
	SOLVE_ORDER = 2, FORMAT_STRING = '#,##0.00;(#,##0.00)'

SELECT
NON EMPTY
	{[Sales Measures].[Sales Measures].[Total Sales Revenue RO],
	 [Sales Measures].[Sales Measures].[Cost of Sales RO]} ON 0,
NON EMPTY
	{Descendants([Product].[Product].[Total Products])} ON 1
FROM [Sales]
WHERE ([Scenario].[Scenario].[Actual],
	[Period].[Period].[2023],
	[Customer].[Customer].[Total Customers])
					WITH
	MEMBER [Period].[Period].[2023].[MAR + 6.75%]
	AS [Period].[Period].[2023-MAR]*1.0675,
	SOLVE_ORDER = 1, FORMAT_STRING = '#,##0.00;(#,##0.00)'
SELECT
NON EMPTY
	{GENERATE(
		{TM1SubsetToSet([Period].[Period],"Current Year Periods","public")},
		{StrToSet(
			CASE
				WHEN [Period].[Period].CURRENTMEMBER.PROPERTIES("MEMBER_NAME") = "2023-MAR"
					THEN "{[Period].[Period].[2023-MAR], [Period].[Period].[MAR + 6.75%]}"
				ELSE "{[Period].[Period].CURRENTMEMBER}" END
			)}
		)} ON 0,
NON EMPTY
  {DRILLDOWNMEMBER(
    {[Product].[Product].[Total Products]},
    {[Product].[Product].[Total Products]}
	)} ON 1
FROM [Sales]
WHERE ([Scenario].[Scenario].[Actual],
	[Sales Measures].[Sales Measures].[Sales Revenue],
	[Customer].[Customer].[Total Customers])
The view returned then shows everything in green shading, just like our Thousands and Millions examples and users are unable to overwrite values but can still copy them if required.
Basic Member Information
Calculated Members can also be strings or text, not just numerical values.
The text could be a specified string, derived string using IIF or CASE statements, intrinsic member information, attribute values or values looked up from other cubes.
Strings
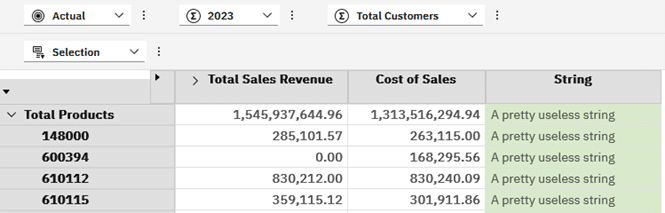
Sticking with our base view of Sales Revenue and Cost of Sales, we may want to add some text on each row using the following example:
					WITH MEMBER [Sales Measures].[Sales Measures].[String] AS
	'A pretty useless string'

SELECT
NON EMPTY
	{[Sales Measures].[Sales Measures].[Total Sales Revenue],
	 [Sales Measures].[Sales Measures].[Cost of Sales],
	 [Sales Measures].[Sales Measures].[String]} ON 0,
NON EMPTY
	{Descendants([Product].[Product].[Total Products])} ON 1
FROM [Sales]
WHERE ([Scenario].[Scenario].[Actual],
	[Period].[Period].[2023],
	[Customer].[Customer].[Total Customers])
We can see our string is repeated on each row and is largely pointless, other than for the purposes of the example.
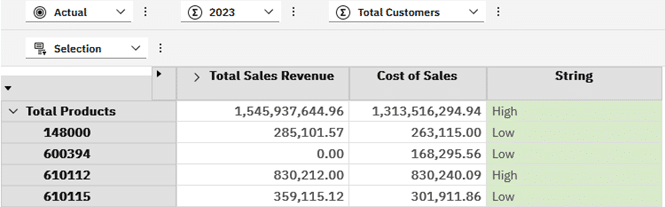
Maybe what would be more useful is to show a string saying High or Low based on the Total Sales Revenue value exceeding 500,000
					WITH MEMBER [Sales Measures].[Sales Measures].[String] AS
	IIF([Sales Measures].[Sales Measures].[Total Sales Revenue]>500000,
		'High',
		'Low')

SELECT
NON EMPTY
	{[Sales Measures].[Sales Measures].[Total Sales Revenue],
	 [Sales Measures].[Sales Measures].[Cost of Sales],
	 [Sales Measures].[Sales Measures].[String]} ON 0,
NON EMPTY
	{Descendants([Product].[Product].[Total Products])} ON 1
FROM [Sales]
WHERE ([Scenario].[Scenario].[Actual],
	[Period].[Period].[2023],
	[Customer].[Customer].[Total Customers])
Our view now shows something a bit more useful but maybe I want to extend this to High, Medium and Low
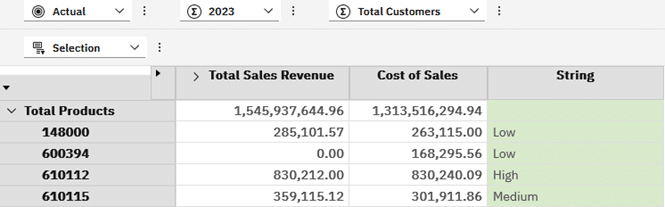
Changing our MDX, I would like to see High as above 500,000, Medium above 300,000 and everything else as Low. Additionally, Total Products is probably not relevant here so will set this to blank. I have also ordered my logic from High to Low so that the first matching case is applied.
					WITH MEMBER [Sales Measures].[Sales Measures].[String] AS
	CASE
		WHEN [Product].[Product].CurrentMember.Name = 'Total Products' THEN ''
		WHEN [Sales Measures].[Sales Measures].[Total Sales Revenue]>500000 THEN 'High'
		WHEN [Sales Measures].[Sales Measures].[Total Sales Revenue]>300000 THEN 'Medium'
		ELSE 'Low'
	END

SELECT
NON EMPTY
	{[Sales Measures].[Sales Measures].[Total Sales Revenue],
	 [Sales Measures].[Sales Measures].[Cost of Sales],
	 [Sales Measures].[Sales Measures].[String]} ON 0,
NON EMPTY
	{Descendants([Product].[Product].[Total Products])} ON 1
FROM [Sales]
WHERE ([Scenario].[Scenario].[Actual],
	[Period].[Period].[2023],
	[Customer].[Customer].[Total Customers])
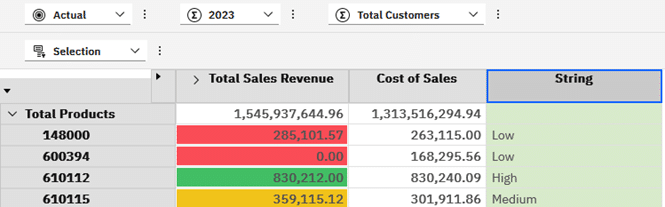
This updated MDX now gives me the following view:
With String values, the next logical idea may be to add conditional formatting like in the below view:
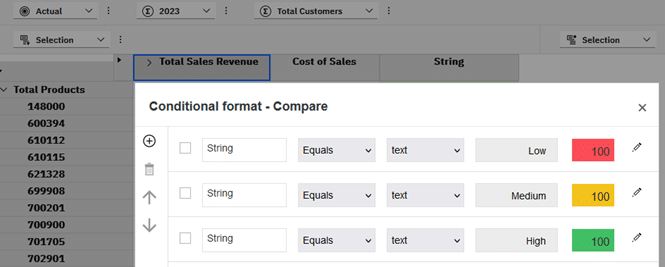
I would likely never use all three boldly coloured formats per the above but this is for illustration purposes. You may also wonder why go to all the trouble of creating a String with High, Medium and Low and setting the conditional format based on that. Why not just set the conditional formatting based on the same values we used in the MDX?
The answer is that in future parts, we will look at reading values from other cubes and the thresholds used to determine High, Medium and Low may be in an assumptions cube and be changed over time. Ideally, we would replace our hard-coded values with those in the assumptions cube, read them, derive the performance string and then the conditional formatting will not require any changes as it is linked to the text in the string, not a value that may change.
Keep in mind too that you could also hide the String column from users as it may only be needed to drive the conditional formatting.
Notes, Validations and other Information
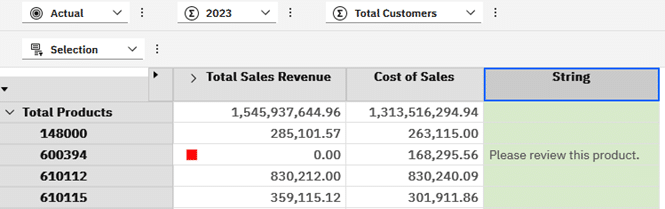
Text Calculated Members may also be useful to highlight potential issues to users. In the example above, Product 600394 does not have any Sales Revenue but does have Cost of Sales. This is likely due to a missing price and may be worthwhile highlighting to the user to make them aware of the issue.
My updated MDX does the validation and sets the text if failed:
					WITH MEMBER [Sales Measures].[Sales Measures].[String] AS
	CASE
		WHEN [Product].[Product].CurrentMember.Name = 'Total Products' THEN ''
		WHEN [Sales Measures].[Sales Measures].[Total Sales Revenue] <=0
			AND [Sales Measures].[Sales Measures].[Cost of Sales] <> 0
			THEN 'Please review this product.'
		ELSE ''
	END

SELECT
NON EMPTY
	{[Sales Measures].[Sales Measures].[Total Sales Revenue],
	 [Sales Measures].[Sales Measures].[Cost of Sales],
	 [Sales Measures].[Sales Measures].[String]} ON 0,
NON EMPTY
	{Descendants([Product].[Product].[Total Products])} ON 1
FROM [Sales]
WHERE ([Scenario].[Scenario].[Actual],
	[Period].[Period].[2023],
	[Customer].[Customer].[Total Customers])
I updated the conditional formatting too and now have something like this where the issue is clearly highlighted:
Note: When working with conditional formatting on text within PAW, you can specify an Is Empty condition but cannot specify a Not Is Empty. Should you need to do this, you can edit the board specification manually, until this shortcoming is addressed.
Member Information
In the MDX code in the previous examples, the first case I am checking relates to testing if the Product being dealt with is “Total Products”. This is hard-coded and may not be ideal. Potentially what is really required is that we only show the performance indicator on Products that are leaf level.
But how would you know if the member in the Product dimension is at leaf level or some other level? You can use intrinsic members to return this information. There is a link at the end of this article to a previous article dealing with intrinsic members in TM1 for further reference.
Let’s construct a view to give us some additional information for the Product members alongside the Total Sales Revenue. I am using a mix of methods to retrieve the required properties.
					WITH
MEMBER [Sales Measures].[Sales Measures].[MemberName] AS
    [Product].[Product].CurrentMember.Name
MEMBER [Sales Measures].[Sales Measures].[MemberUniqueName] AS
    [Product].[Product].CurrentMember.UniqueName
MEMBER [Sales Measures].[Sales Measures].[MemberCaption] AS
    [Product].[Product].CurrentMember.Properties("Member_Caption")
MEMBER [Sales Measures].[Sales Measures].[MemberType] AS
    [Product].[Product].CurrentMember.Properties("Element_Type")
MEMBER [Sales Measures].[Sales Measures].[MemberLevel] AS
    [Product].[Product].CurrentMember.Properties("Element_Level")
MEMBER [Sales Measures].[Sales Measures].[ChildrenCount] AS
    Count([Product].[Product].CurrentMember.Descendants) - 1

SELECT
NON EMPTY { [Sales Measures].[Sales Measures].[Total Sales Revenue],
	 [Sales Measures].[Sales Measures].[Cost of Sales],
	[Sales Measures].[Sales Measures].[MemberName],
	[Sales Measures].[Sales Measures].[MemberUniqueName],
	[Sales Measures].[Sales Measures].[MemberCaption],
	[Sales Measures].[Sales Measures].[MemberType],
	[Sales Measures].[Sales Measures].[MemberLevel],
	[Sales Measures].[Sales Measures].[ChildrenCount]
	} ON 0,
NON EMPTY {Descendants([Product].[Product].[Total Products])} ON 1
FROM [Sales]
WHERE (
    [Scenario].[Scenario].[Actual],
    [Period].[Period].[2023],
    [Customer].[Customer].[Total Customers])
Our view now has quite a bit of useful information to review:
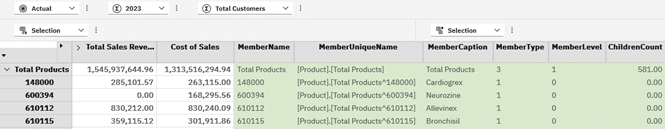
MemberName: Not that useful here as the set is showing this by default, but may be more useful when the set has an alias applied.
MemberUniqueName: The MUN shows the fully qualified name of the member that uniquely identifies it. Remember from Part 1 that there is a difference between elements and members and you will end up with many more members than elements in your dimension where elements are part of multiple rollups.
MemberCaption: Typically your Description alias assigned to your dimension/hierarchy. Keep in mind that Caption as an alias is preferred and when designing for multiple languages/locales, is required.
MemberType: Members can be created as leaf level, consolidations or strings. You can easily see that in the above, 1 indicates a leaf, 3 a consolidation and what is not shown as MemberType 2 which is for string members.
MemberLevel: This is different to using .Level against the member. When using MemberLevel, we start from 0 for leaf elements and increment as we move up through the rollup.
ChildrenCount: This was added to show that you can still add additional information that may add value to your audience.
With all of this in mind, we may want to revisit our MDX and rather update the Case statement to blank out the string where the MemberLevel for Products is not leaf i.e. level 0.
					WITH MEMBER [Sales Measures].[Sales Measures].[String] AS
	CASE
		WHEN [Product].[Product].CurrentMember.Properties("ELEMENT_LEVEL") <> "0" THEN ''
		WHEN [Sales Measures].[Sales Measures].[Total Sales Revenue]>500000 THEN 'High'
		WHEN [Sales Measures].[Sales Measures].[Total Sales Revenue]>300000 THEN 'Medium'
		ELSE 'Low'
	END

SELECT
NON EMPTY
	{[Sales Measures].[Sales Measures].[Total Sales Revenue],
	 [Sales Measures].[Sales Measures].[Cost of Sales],
	 [Sales Measures].[Sales Measures].[String]} ON 0,
NON EMPTY
	{Descendants([Product].[Product].[Total Products])} ON 1
FROM [Sales]
WHERE ([Scenario].[Scenario].[Actual],
	[Period].[Period].[2023],
	[Customer].[Customer].[Total Customers])
In the first case statement we now use “ELEMENT_LEVEL” for the Product to determine if we should show a blank or derive the performance indicator in the “String” measure.
Using a different set on the rows to illustrate the results a bit better I have the following:
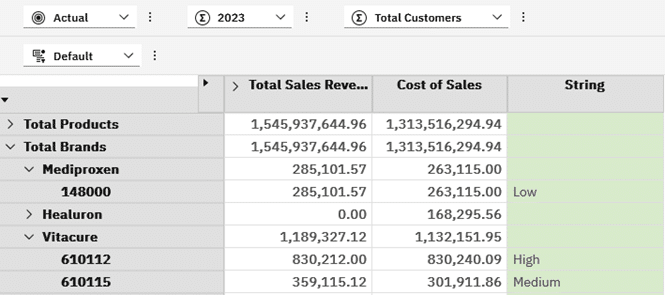
Products that are level 1 like Total Products, and brands like Mediproxen, Healuron and Vitacure have blank values whereas the leaf level products show the performance indicator.
Summary
In this part, we looked at a quick recap of using numerical Calculated Members to derive Gross Margin and Gross Margin % using some basic mathematical operations and then applied some formatting to make the results more readable.
We then looked at using Calculated Members to show values on different scales e.g. Millions and Thousands. This approach reduces the overhead required in a TM1 model where the rules may apply to millions of cells. Processing is done by the client machine rather than in the TM1 server. Often a user may typically only review the results at a very high level and there is no need to have the values in the cube for millions of cells never reviewed.
Deriving new measures on a different scale then took us to deriving alternate measures to show these as read-only to users in cases where there is risk that users may inadvertently change numbers or where the designer wants all values read-only or shaded similarly for consistency.
Our next examples dealt with adding strings to our view by using Calculated Members set to a string value or derived using logic within and IIF() and CASE statements.
These conditional statements allowed us to show results within bands like High, Medium and Low, as a performance indicator which could be linked to conditional formatting for extra effect. Similarly, we used some logic to highlight potential concerns with values like missing pricing resulting in Sales Revenue being zero.
Additional logic was required to avoid showing the performance indicators on non-leaf members as these would be meaningless. This took us into adding Calculated Members relating to intrinsic members for each Product and gave us additional information like the type of member and the level. Using the member’s level we could adjust our MDX to blank out the performance indicator on non-leaf members.
In the next part we will extend what we have learned to reading other properties of members like attributes that have been added.
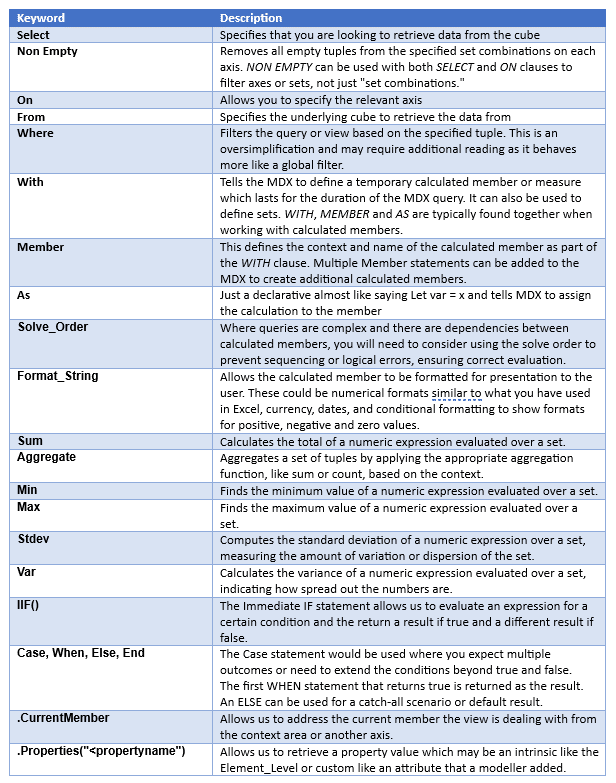
A summary of the MDX view related keywords used up to now:
By George Tonkin, Business Partner at MCi.
Further Reading
Part 1 – Learning MDX view in Planning Analytics
Part 2 – Using Calculated Members in MDX
Part 3 – Aggregate Calculated Members in MDX
Part 4 – Using Calculated Members to Add Information
Part 5 – Working with Attributes in MDX Views
Part 6 – Working with Time Series in MDX Views
Part 7 – Using Lookup Cubes to Extend Your Queries
Part 8 – Joining Related Cube Data
Part 9 – Joining Related Cube Data(Part 2)
TM1/Planning Analytics – MDX Reference Guide
Working with Time Related MDX Functions
Discovering MDX Intrinsic Members